We have now talked about light emission and absorption processes, but let's talk a little bit more about the interaction of light and matter and about how solar system objects that we have recently discussed look like at different wavelengths. Telescopes come in two classes: refractors and reflectors. Refractors bend light, reflectors use mirrors to alter the path of light:
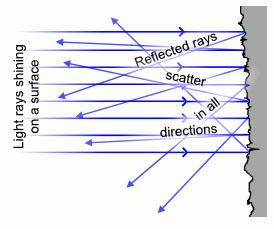
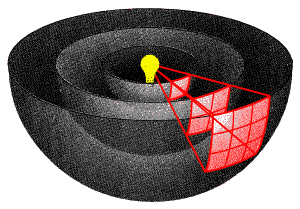
But all surfaces/objects reflect some amount of light---the floor, the walls, the table. And the angle which light is reflected, or scattered, can be different for different surfaces and therefore affect an object's appearance. Some surfaces are special, like a mirror, but so too is our projector screen, which is reflective, but one that "scatters" light in all directions:
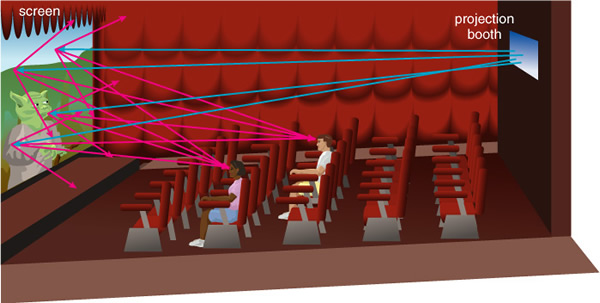
This allows you to view the image from different angles. For visual light, the light we can detect with our eyes, most substances merely reflect the light without changing its properties--or at least most wavelengths of light. In Figure 5.3 is a little cartoon showing how light reacts with matter:
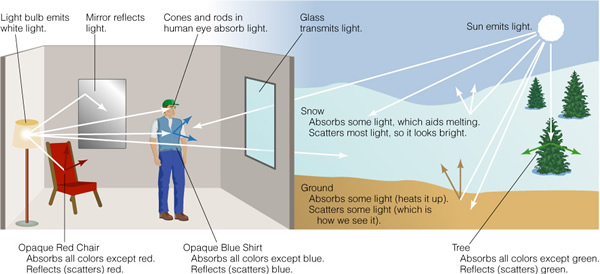
Red things look red because the reflect red light well, while absorbing all other colors. White things look white because they reflect all colors of light well. But what does this actually mean? There are four things that matter can do with light: 1) nothing (transmit it), 2) refract (bend) it, 3) absorb it, or 4) reflect/scatter it. Now, no object does any of these things perfectly, even for limited ranges of wavelength. For example, glass appears to be clear, but in fact all glass surfaces reflect some small amount of light. Normal glass reflects about 4% at its front surface and 4% at is back surface--thus it only transmits 92% of the light that hits it. This is due to the change in the "index of refraction" between the air and the glass. But even the best glass has imperfections (tiny bubbles and cracks), so there is also some scattering, reducing the amount of transmitted light further. "Anti-reflection" coatings are materials with a reduced index of refraction deposited on the glass surface and have an index of refraction between that of the glass (n = 1.5) and that of the air (n = 1.003). For limited wavelength ranges, you can improve the transmission rate significantly. Here is the reflectance curve of a standard coating on glass:
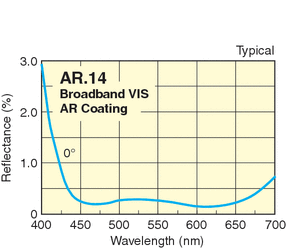
Note that this coating only works for limited range in wavelength, and starts reflecting in the blue---this is why many coated camera lenses appear bluish--they reflect more in the blue. The transmission and reflectance of light at optical surfaces is due to the wave nature of light, rather than how the electrons are arranged in the atoms of elements that comprise the glass. This is also true for the refraction that occurs when light enters a transmitting medium---in glass, light travels more slowly than it does in air (speed = c/n). This is how lenses bend light and form an image.
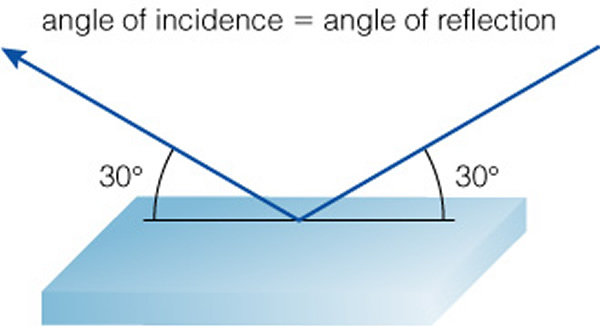
Why are some surfaces shiny, or mirror-like? Usually these are metals. Metals have large amounts of electrons that are loosely bound and can wander from atom to atom (that's why metals conduct electricity). These electrons can also reflect light--but how well a surface reflects light is a measure of how smooth the surface is. Mirrors are very smooth, so the light bounces backwards at the angle it arrived at ("angle of incidence = angle of reflection"). But a rougher surface (even if a shiny metal) looks duller because it scatters light in many directions:
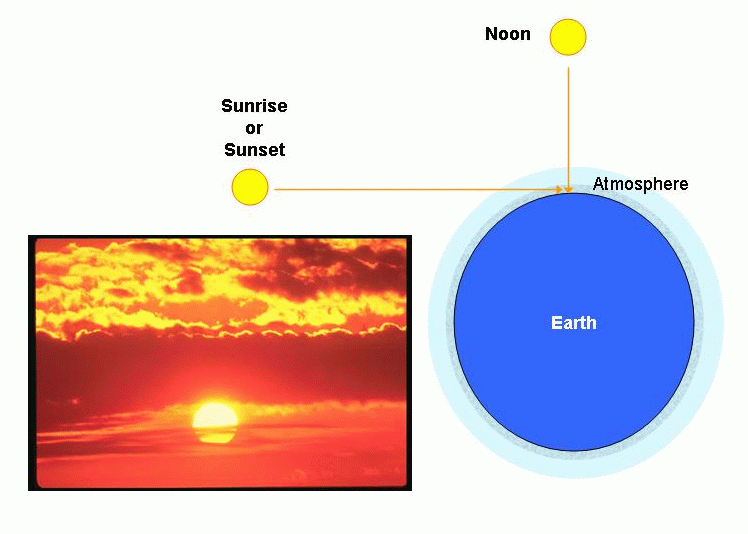
Ok, now we have covered scattering, we can answer the question "why is the sky blue". The sky is blue because air molecules scatter blue light better than red light---note that a typical atom is about the same size as the wavelength of (visible) light. The light interacts with the molecules of nitrogen and oxygen in our atmosphere, and scatter light in all directions. It is just that blue light is scattered more easily than red light (it contains more energy, and thus affects the molecules more than red light). If we could actually detect it, the sky would be violet, but our eyes don't have that type of response:
If the sky is blue, why are sunsets red? Because dust absorbs blue light better than red light, allowing it to pass, and that path at sunset is longer:
Also note that a sunset is generally redder than a sunrise---why? With daytime heating, more wind can be generated, and more dust lifted into the air. As the night cools, the winds will die off, and the dust will settle.
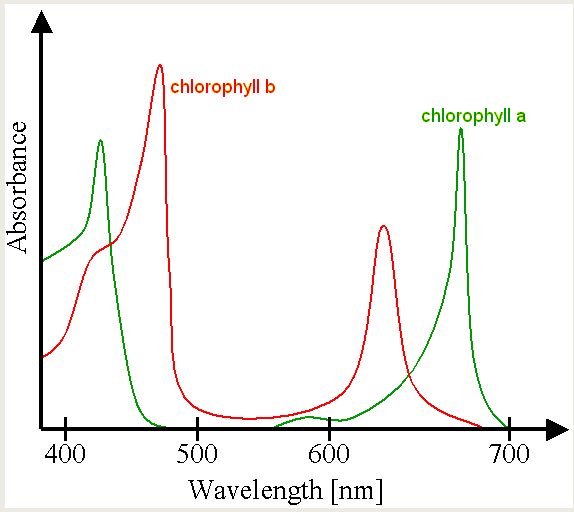
Ok, now lets look at why things have "colors". As noted above, things look blue or red because they preferentially reflect those colors, while absorbing others. Let's take plants--plants are green because the absorb the other colors, and reflect green. This is due to the chlorophyll molecule's spectrum:
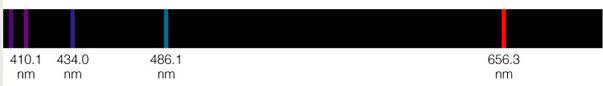
Just like atoms, molecules have spectra. Whereas atoms have discrete energy levels for electrons, molecules are much more complicated, containing multiple elements that share electrons. And not only that, they bend and vibrate. Below are the emission line spectra of the element hydrogen, and the molecule H2:

All of the extra lines are just due to the fact that molecules can change their shapes, and this means electrons can move in complex ways.
So far we have really confined our discussion to the visible portion of the electromagnetic spectrum. But objects emit a wide variety of radiation, and astronomers use all of these to understand the nature of the objects they study. Lets go back to figure 5.19 again:
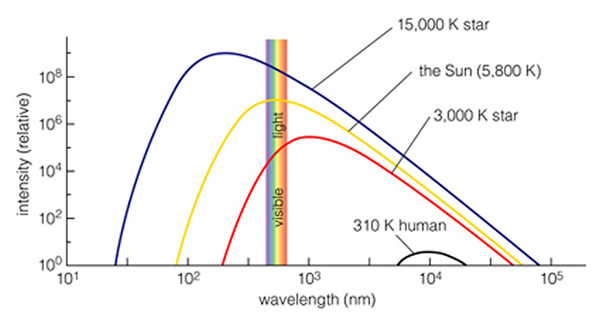
All objects emit a spectrum that is characteristic of their temperature. In this plot, we have the spectra of three stars and a human being. Note the visible spectrum is a tiny, tiny piece of the electromagnetic spectrum. The shape of this curve, the "blackbody" spectrum, is a constant, and only the location of the peak changes with temperature. We see that the Sun has a temperature of 5800 K, and most of its light comes out in the visible part of the spectrum (that's why our eyes work there!). But the Sun emits light that is both bluer (higher energy) and redder (lower energy) than just the visible. Light that is too blue for our eyes to see is called "Ultraviolet", while light that is too red is called "Infrared". A very hot star emits more ultraviolet light, while a cool star emits more infrared light. Since planets, and humans, are much cooler than the coolest star, they Everything in the Universe has a temperature, and therefore emits a spectrum that corresponds to that temperature. Let's take a look at the spectrum of Mars:
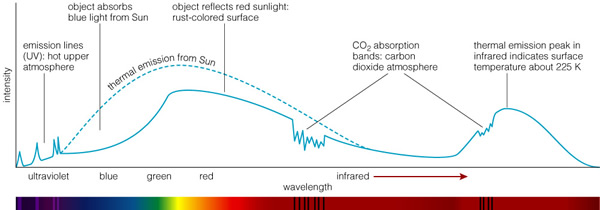
The dashed line shows the spectrum of the Sun (like that in the previous figure). Note that Mars, the "red planet", appears red because it reflects more red light than blue--it absorbs blue. But note that it isn't perfect, it absorbs some red light too. But note other features in the spectrum. In the near-infrared there are strong CO2 absorption features because Mars' atmosphere is almost pure CO2. Since the Sun emits some ultraviolet light, this can "ionize" atoms in the upper atmosphere, and these de-excite to emit UV lines. The heating of Mars means that the planet maintains a temperature very close to 225K, and thus it also emits a cool blackbody in the infrared. If you summed up all of these components, they would exactly equal that amount of thermal emission from the Sun that is intercepted by Mars (they have to since Mars does not generate its own heat anymore!). Here are infrared spectra of Venus, the Earth and Mars:
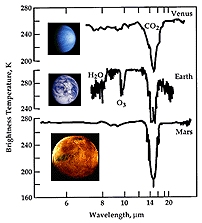
Note that the spectra of all three planets show the presence of CO2, but the Earth also has water absorption, and ozone (O3). Thus, spectroscopy at different wavelengths allows us to figure out both the temperature and composition of an object.
Infared: So let's examine how objects appear in the infrared. This is sometimes called "thermal imaging", as what we are detecting is the heat of an object/body. Here is an infrared image of a dog;
The yellows and whites indicate more light---the dog's mouth, eyes and ears are warm, and therefore "bright". But the dogs fur is cool, so it appears darker. Let's look at a comparison for Jupiter between visual and infrared:
The image in visible light shows us where there is strong reflection of the light of the Sun (white means higher reflectance), while the infrared radiation shows us where the heat from Jupiter is escaping (Jupiter generates a lot of internal heat). This allows us to understand the layers at which the clouds form, and how the circulation of the atmosphere is working.
Ultraviolet: Just to the blue, or higher energy side of the visible light window is the ultraviolet. Some of you are familiar with ultraviolet light as the source of sunburns, or maybe from "black lights". These are the lowest energy photons of the ultraviolet. In contrast to infrared light, UV light carries a lot of energy, and thus can ionize atoms. Objects that emit a large amount of UV light typically have temperatures above 10,000 K. While most UV light is reflected from planets, some penetrates the atmosphere and creates zones of ionization--the "ionosphere" for example. The so called "ozone" (O3) layer of our atmosphere blocks most UV light from reaching the ground. Below is a picture of Jupiter in ultraviolet light which shows that most of the emission occurs near the planet's polar regions due to collisions between energetic particles and its atmosphere. These are the "aurorae" of Jupiter:
X-Rays: Beyond the ultraviolet, at higher energies we find X-rays. X-rays are so energetic they penetrate matter, and in the process can damage tissues, and other structures. But a number of objects in the solar system can be observed in X-rays--especially the Sun--and provide additional insight. One of the biggest surprises was that comets, as shown below
are detectable in X-rays. This is due to the interaction of the cometary gases with X-rays from the Sun. Very few planets actually emit X-rays, though the auroral regions of Jupiter have been observed:
Radio: At the other end of the energy range are radio observations. The processes that lead to radio emission are complicated, and we will not go into them here. But it is important to note that when magnetic fields are present, particles that get trapped in them emit radio waves. Thus, several planets are radio sources. For some images go here . We can also "image" some planets using radar. For example, the surface of Venus is obscured by thick clouds. Radar (radio waves!) can penetrate the clouds and reveal the surface. We will see numerous images of Venus that were made using radar (as shown below).
Here is a multiwavelength comparison for Venus (UV, Visible, IR, and radio):
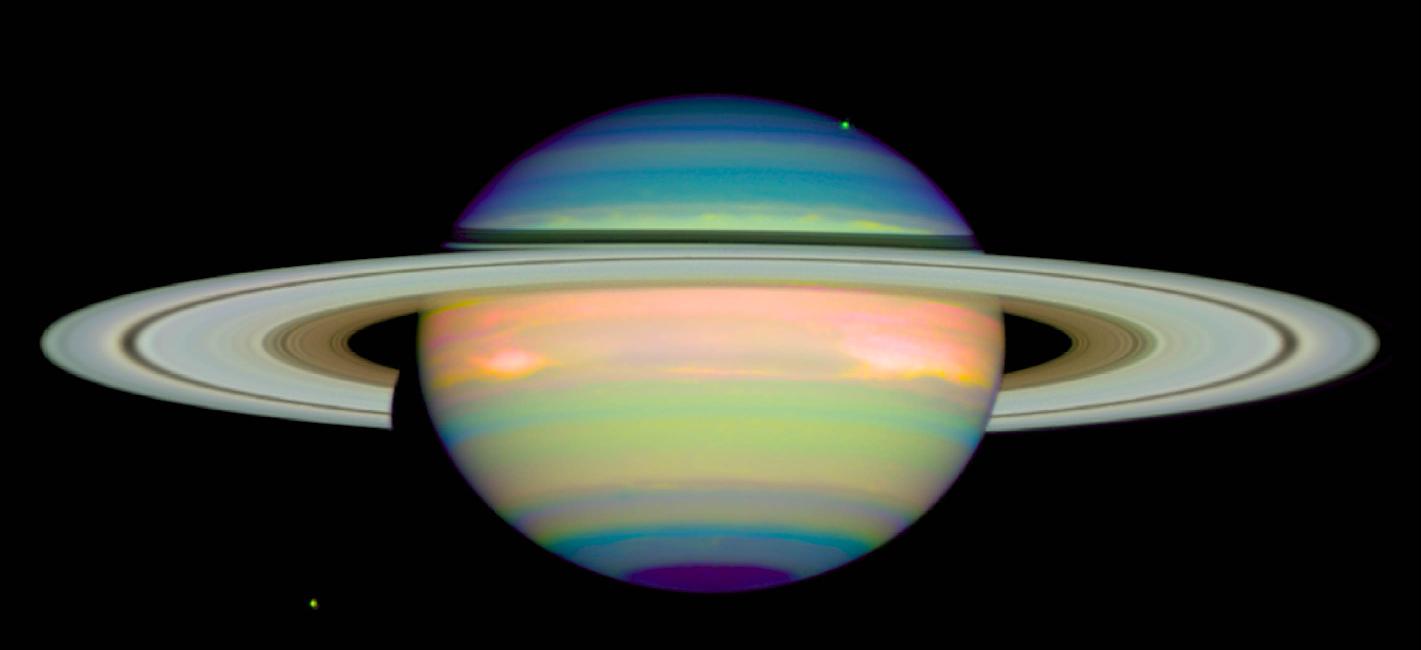
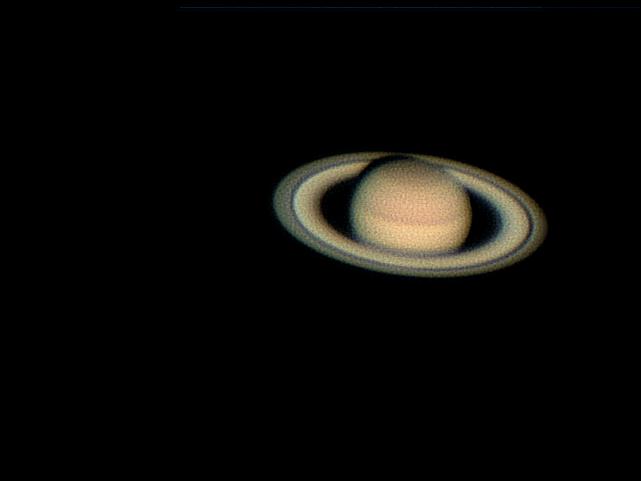
And here are UV, visible and IR images of Saturn:
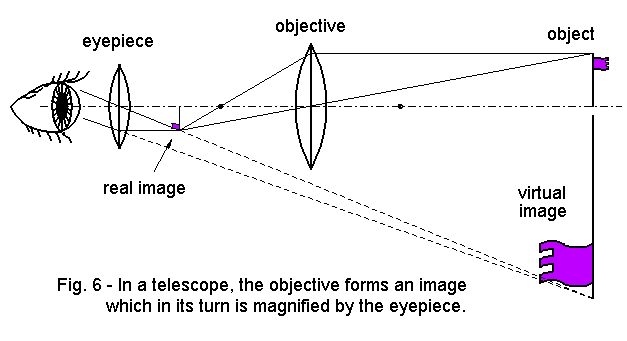
Some of the images in previous lectures were taken through a telescope (and you will see more in the coming weeks). Telescopes are used to make objects both brighter, and bigger. Before we begin our exploration of the more distant reaches of the Universe, we need to take a brief excursion to talk about optics and telescopes. As we noted a week or two ago, Galileo is given most of the credit for being the first to use a telescope for astronomical purposes. But glass lenses have been around since at least 1100 AD, and eyeglasses seem to have been developed in the 13th or 14th century. What good is a telescope? First, let's look at something you are familiar with, your eye:
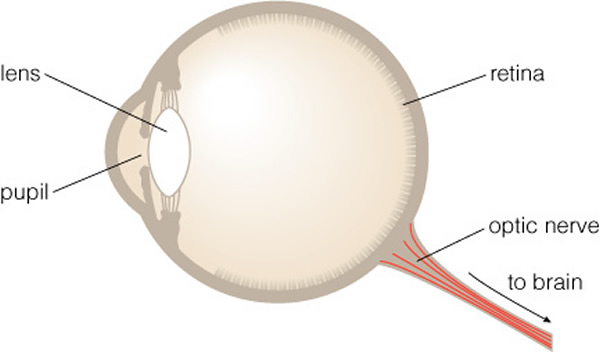
Your eye has a pupil and a lens.
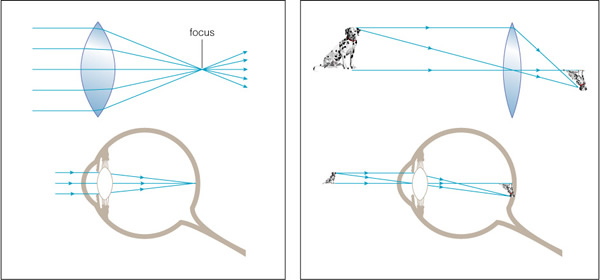
So, how does a lens work? Well, when light encounters the glass, its speed slows down---light travels more slowly in glass then in air, or in empty space. Thus, if light encounters a tilted piece of glass like that shown below:
it is bent. Think of a marching band trying to march in a line and then executing a turn while trying to remain in a line--those on the outside tip of the line have to walk faster while those on the inside edge of the turn are not moving at all. Now picture a marching band that is in a diagonal line formation marching up a football field, but when they get to the 40 yd line they encounter thick mud. The first band members that hit the mud all of a sudden march more slowly, while those in the dry portion of the field keep marching at the same speed until they hit the mud. This causes a slight bending in the line as they go through the mud. So in glass, the bottom portion of the light beam in the figure above hits the glass surface first, slows down first, and this causes a turn in the beam.
In the eye the lens forms the image (upside down!), while the pupil adjusts in size to allow you to let in more light when it is dark, or less light when it is bright. The size of the pupil is what controls how faint of an object you can see. For example, owls have large pupils to allow in more light since they hunt at night. Cats have sensitive eyes, so when it is bright out, their pupil contracts to a very narrow slit (for more on the nature of the human eye, go here.). The size of the lens is the controlling factor for how faint a light source you can see. That's the first important property of telescopes---they "collect light". Looking through a telescope is like replacing your small eye lens with a much bigger lens. The second important property of a telescope is its ability to magnify objects to see finer detail. The amount of detail that you can see depends on the size of your pupil---or the diameter of the lens of a telescope. This is very similar to parallax. The larger the baseline used in a parallax measurement, the smaller angles (finer details) you can measure. The two extreme edges (diameter) of a lens are your "baseline" for creating detailed images. That is why big telescopes are valuable, they collect light, and allow you to magnify an image to see fine detail.
The amount of light a telescope collects depends on its area. For example, the largest dilated human eye pupil has a diameter of about 8 mm. Therefore, it has an area of 50 square mm (π R2!) A one inch telescope, like Galilo had, has an area of (d= 1 inch = 25mm) 490 square mm. Galileo's telescope collected 10X more light than the human eye, allowing him to see stars that were 10X fainter than those visible with the naked eye. The largest telescope (Keck) has a diameter of 10 meters (10,000 mm), it collects 1.5 million times as much light as the human eye.
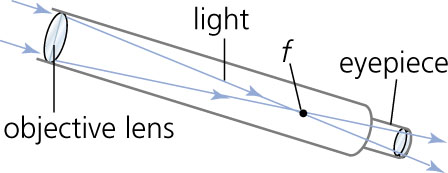
During the late 17th and early 18th century, telescope technology was quickly improving. As with Galileo's primitive telescope, nearly all the instruments of that time were "refractors". Refractors use lenses to bend the light to a focus where an eyepiece (similar to a little microscope) magnifies the image:
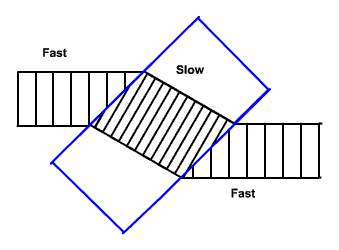
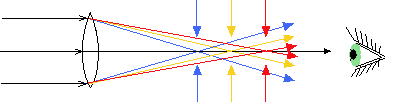
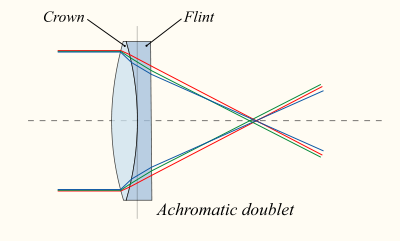
The problem with early refractors was that they used only a single glass lens, and this arrangement could not bring all colors of light to a common focus. Thus, everything you looked at had blue and red images that were not in focus. This is called chromatic abberation:
To counteract chromatic abberation, the first telescopes were made to be very long. Some of these telescopes had small lenses, on the order of 3" in diameter, but were more than 20 feet long (the longest ones approached 75ft):
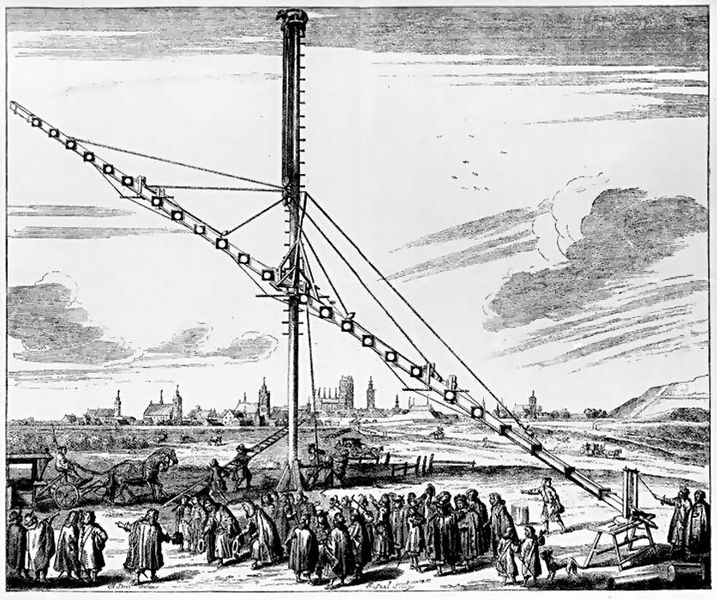
This made them difficult to use, and discoveries made with them were rather slow in coming. Though, Christiaan Huygens used one of these primitive telescopes to discover Titan, the largest Moon of Saturn, and to figure out the true nature of Saturn's rings (that's why the probe that entered Titan's atmosphere in 2005 was named "Huygens").
It was discovered later that mixing two (or more) types of glass could counteract the chromatic aberration, and all modern telescopes and camera lenses have more than one lens:
One of the major contributions of Isaac Newton was his book on optics entitled Opticks, published in 1704. One of his proposals was to use a curved mirror to focus light to eliminate chromatic aberration. Newton knew that all light, no matter its color, suffers an identical reflection, thus a telescope using a mirror as its objective would eliminate most of the chromatic abberation suffered by refractors. Using mirrors, telescopes could grow in light gathering ability without becoming too large to manage. One of Newton's designs for such a telescope still bears his name:
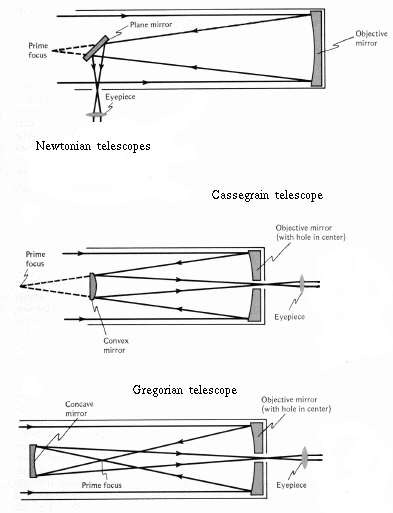
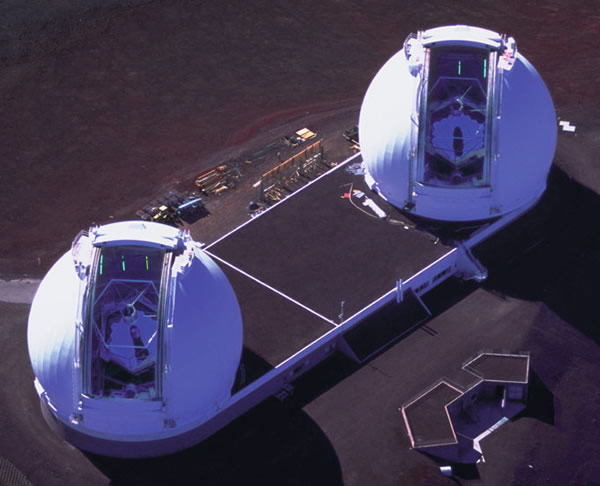
Besides providing better image quality, telescopes with a single curved mirror were easier to produce than refractors (that have two curved surfaces). They were also cheaper. Currently, the world's largest telescopes are the 10 m Keck telescopes:
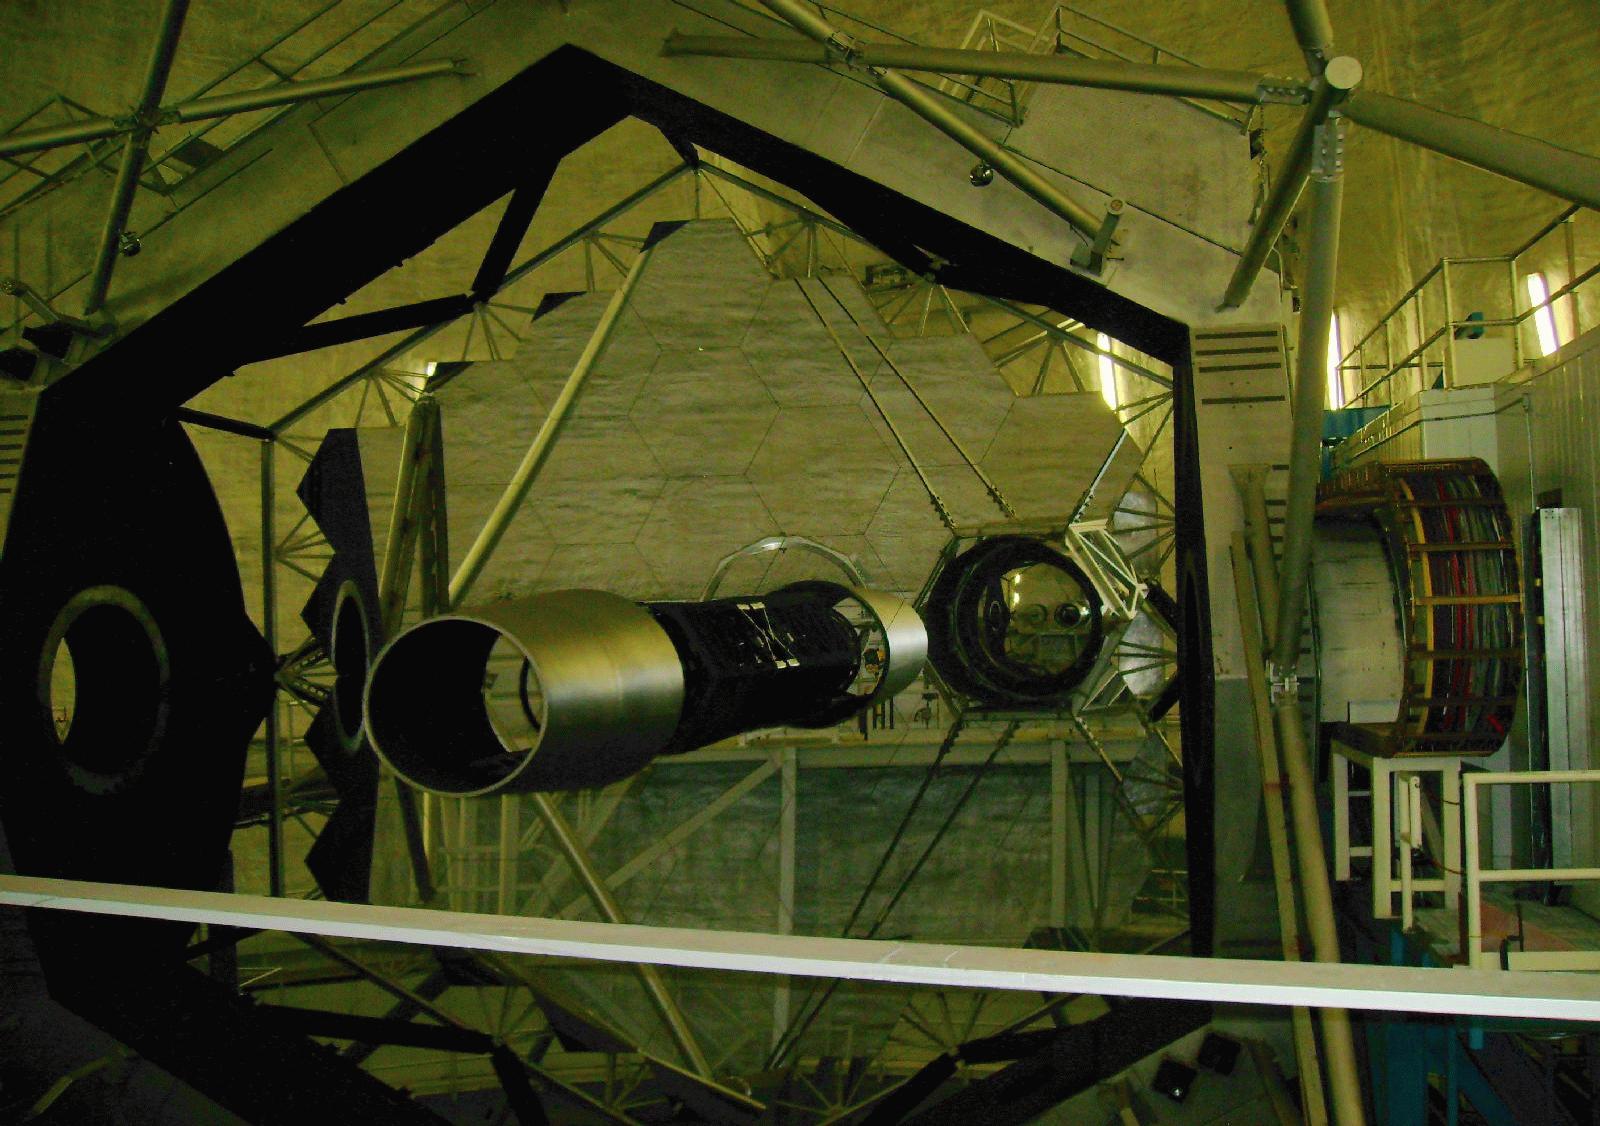
Because it is extremely difficult to make a single piece of glass that is 10 m across and optically perfect, the Keck mirrors are segemented:
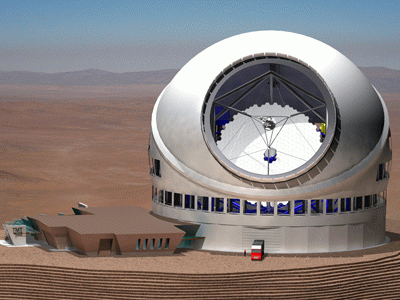
The next generation of mammoth telescopes are being planned, like the "Thirty Meter Telescope":
The desire for larger and larger telescopes is due to the need to detect the weak, faint objects found in astronomy. But larger isn't all that we need, going into space allows us to get above the distorting atmosphere. Here is an example:
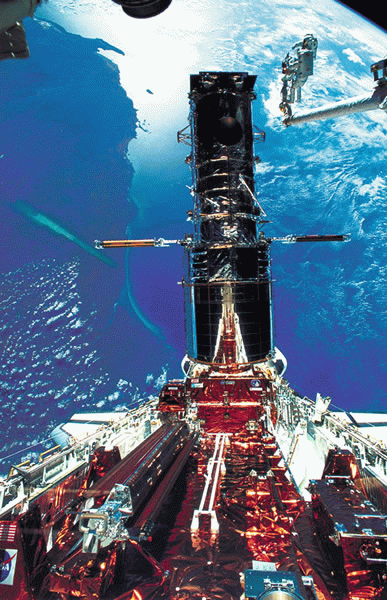
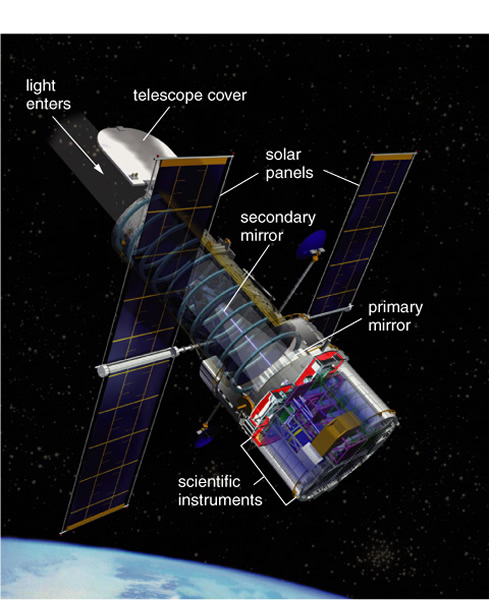
This is why the Hubble Space Telescope was launched:
But techniques are being developed to allow ground based telescopes to reduce the affects of our atmosphere ("adaptive optics"), where a flexible mirror is used to improve the image.
Most cartoons you see have astronomers looking into eyepieces and making drawings. But just about all astronomy now uses digital detectors like those used in your digital camera:
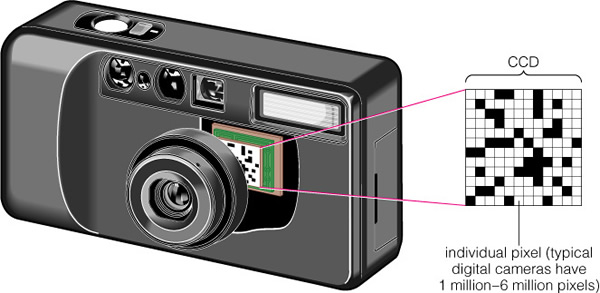
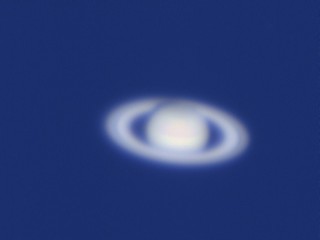
The only difference is we use better quality detectors, bigger detectors (>60 "megapixels"), and chill them to extremely cold temperatures to get rid of electronic noise. But even with simple webcams, you can get amazing quality--here is comparison between a typical snapshot, and an image made by processing a short movie of Saturn using a webcam at our campus observatory:
Astronomers build bigger and bigger telescopes to collect as much light as possible. This is because the brightness of an object falls off as 1/R2, that is if you double the distance, the object is only 1/4th as bright, because the light spreads out as it travels:
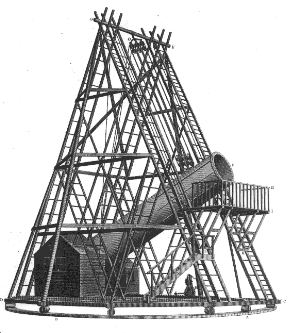
One of the first people to successfully build and use a large reflecting telescope was William Herschel (1738 - 1822). A drawing of his largest telescope is shown, below.
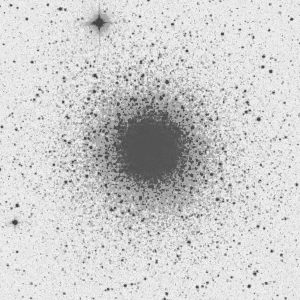
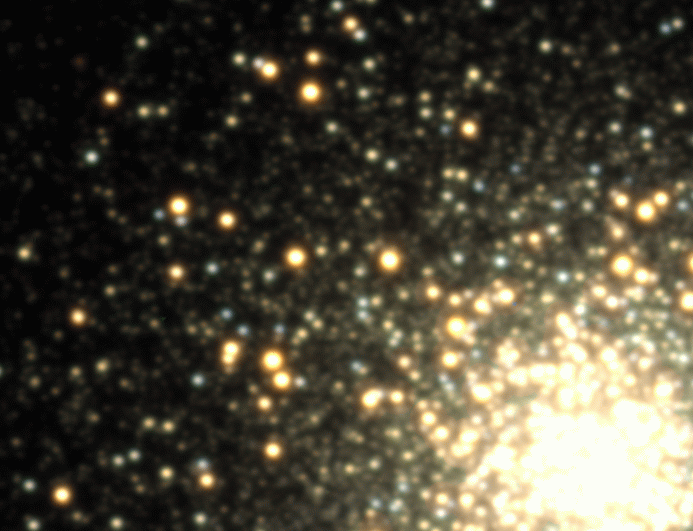
Herschel is best known for his discovery of Uranus in 1782, a discovery that would give him a secure future as "astronomer to the king". Herschel also discovered two moons of Saturn, as well as two moons around Uranus. He also observed binary stars, and showed that their orbits followed Newton's laws, and thus these laws appeared to be "universal" (that is, they worked everywhere in the Universe the same way as on Earth). But the contributions we are most interested for our story is his work on counting stars to understand the shape of the Milky Way, and cataloguing "nebulae". The term nebulae, which means cloud-like, are simply fuzzy objects that are located throughout the sky. Some of these were obviously clusters of stars: in small telescopes you may not recognize them, as the stars are too faint to see, but using a larger telescope they are "resolved" into dozens, hundreds, or even thousands of stars. An example is the globular cluster M15 shown below. In a small telecope it appears to be just a fuzzy blob--like a comet without a tail. But in a larger telescope (4" objective or larger) it breaks up into thousands of stars:
Before Herschel's time, only about 100 of these objects were known. After Herschel got done, more than two thousand were known. While some of these objects were clearly clusters of stars, other fuzzy objects would not break-up into stars no matter how big of a telescope was used to observe them. Some of those objects looked like pinwheels.
As we mentioned last lecture, Immanuel Kant (1724 - 1804) had proposed that the Milky Way was a disk of stars. He also proposed that there might be other such systems in the Universe, and that some of the nebulae seen in telescopes were these "island Universes", just distant versions of the Milky Way. However, Kant did not have any evidence for this conjecture. (Kant is well known to some of us for being the first name used in Monty Python's Philosopher's song.) After many years of counting stars, Herschel had come up with his model for the Milky Way that closely resembled that of Kant's guess.
When the first stellar parallax was measured in 1838 by Bessel, it was quickly realized that the stars were very far away, and from this that the Milky Way was very large in extent. It would take a bit more work before the true size and shape of the Milky Way, as we described in the last class, was identified in the first half of the twentieth century.
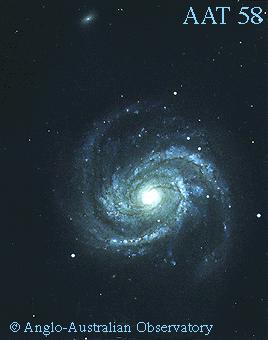
It was left to William Parsons (1800 to 1867), the third Earl of Rosse, however, to finally prove Immanuel Kant was correct about the "island universes". Given his resources, Parsons was able to start work building larger, and larger telescopes. His first attempt had a metal mirror that was 36" in diameter. Not satsified, Parsons constructed a 72" mirror. He quickly went about building a telescope with this mirror that had a tube that was 56 feet long! Here is a photo of one of his telescopes:
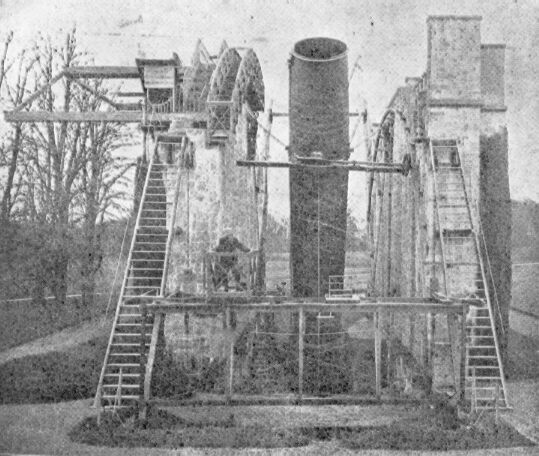
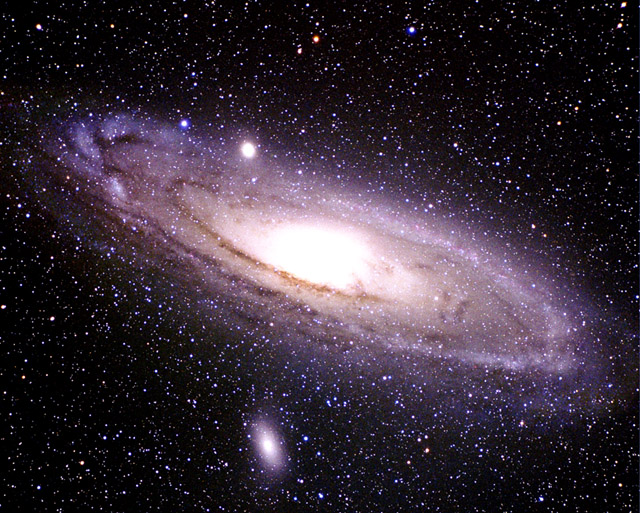
The "6 foot" telescope, finished in 1845, would be the largest in the world until the 100" telescope was built at Mount Wilson (in California) in 1917. With this telescope Parsons was able to have an instrument that would allow him to resolve the largest, and hence "closest" nebulae into stars. The first one of these was an object called Messier 33:
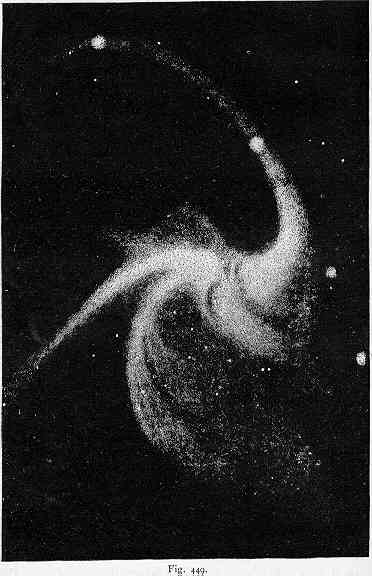
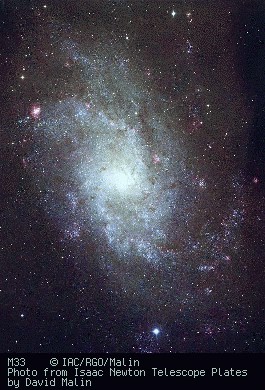
A modern image of Messier 33 is shown below (it is rotated by 90o from Parson's drawing):
Thus, it was suddenly realized that Immanuel Kant's suggestion about the true nature of some of the nebulae was correct, they were "island universes" just like the Milky Way. It would take a lot more work to figure out how far away these objects were.
Except for the two Magellanic Clouds (visible from the southern hemisphere), which turn out to be small, satellite galaxies of the Milky Way, we did not know the distances to any other galaxies: they were so far away that we could not obtain spectra of the individual stars. Only the most luminous stars were visible, and these stars are difficult to use for distance estimates due to their large intrinsic spread in luminosity. We needed some type of star that we could measure a distance to without having to obtain a spectrum (Note that you can image these faint stars quite easily, but to obtain a spectrum of a star, you have to break up the light by a factor of 1000 or more. Thus you could image stars that were 1000X fainter than the stars for which you could obtain a spectrum). The breakthrough came with the discovery of "Cepheid variables" (named after the first one discovered in the constellation Cepheus). Cepheid variables display a continually, and smoothly changing brightness with time. The "light curve", the plot of brightness versus time, of a Cepheid variable is shown below:
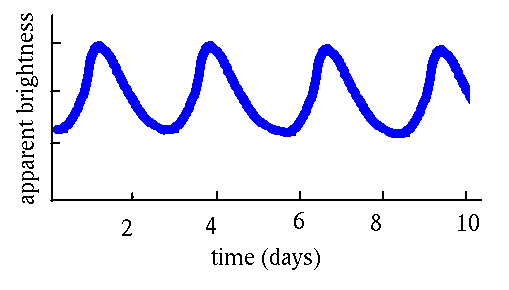
It was soon discovered that the absolute luminosity of a Cepheid variable was directly related to its period, the longer the period between two maxima (or minima), the more luminous the star. The relationship was soon calibrated, and the result is the "Period-Luminosity" diagram/relationship:
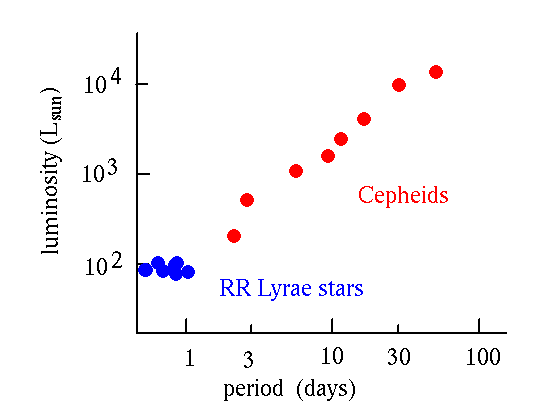
Thus, if you could find a Cepheid variable (or better yet, many such objects) in a distant nebula, all you had to do was measure its period, and you could then determine its distance! Another useful star of similar nature are the "RR Lyr" variables, a kind of star that all have the same luminosity, but are fainter, and pulsate much more quickly than Cepheids. Here is a time series movie of a globular cluster showing a large number of these pulsating variables:
The discovery of Cepheid varaibles in other galaxies now meant we could figure out their distances! This was done for the biggest, and brightest nebulae--those expected to be the nearest examples--and we soon found out how big the Universe was. For example, Messier 33 mentioned earlier was found to be 3 Million light years away! We could see other galaxies like Messier 33 in deep photographs, and these objects were small and dim--they must be 100's of millions of light years away! The Universe was truly enormous.
But this realization also lead to another conclusion: that the space between galaxies was mostly empty. We could determine the extent of the Milky Way, and the other nearby galaxies--our local Universe is mostly empty, with the galaxies filling less than 1% of the volume!
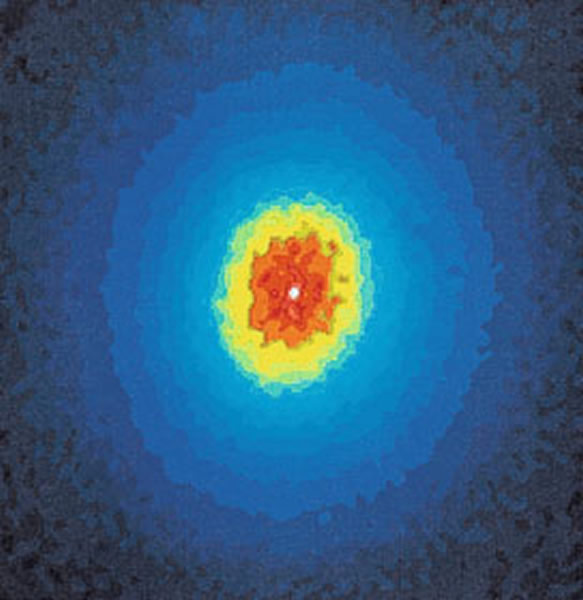
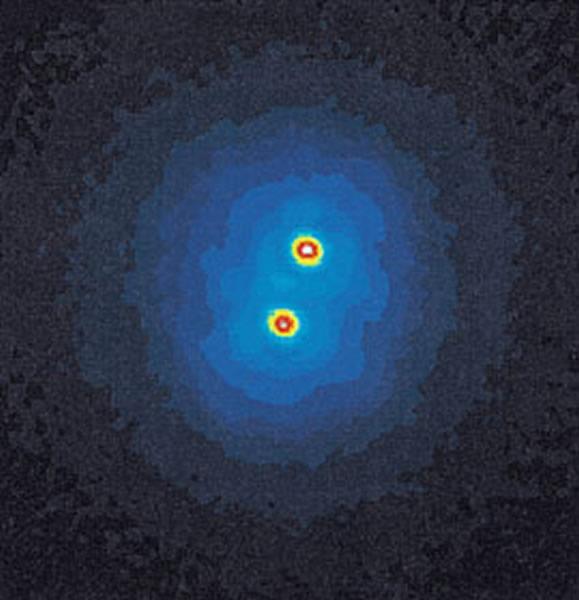
Now astronomers had some tools to allow them to map the Universe. But this was not as easy as it sounds. While Cepheid variables were an excellent way to measure distances within the Milky Way, they really were not bright enough to see at distances much beyond the very local neighborhood. Before we go much further, we first must use a more useful unit of distance, the Mega-parsec (Mpc). Astronomers devised the unit of parsecs from parallax. A star that had a parallax of one arc second (a "parallax second") was said to be "one parsec" away. An object at ten parsecs would have a parallax of 1/10th of an arcsecond, and so on. A parsec is 3.26 light years. Remember that a light year is the distance light travels in one year: (3 x 10⁵ km/s) X (3.15 x 10⁷ sec/yr) = 9.46 x 10¹² km = 5.68 x 10¹² miles, that is, almost 6 trillion miles. Thus, a parsec is about 18 trillion miles. A Mpc is one million times that. The nearest large galaxies Messier 31 (the "Andromeda Galaxy"), and Messier 33, are only about 1 Mpc away. It is quite easy to see Cepheids in both of these nearby galaxies using rather modest telescopes (those with mirrors with diameters of 1 meter). Even using the Hubble Space Telescope, the furthest we can see Cepheids is 17 Mpc. For example, here is what a Cepheid looks like in M100, a galaxy at 17 Mpc:
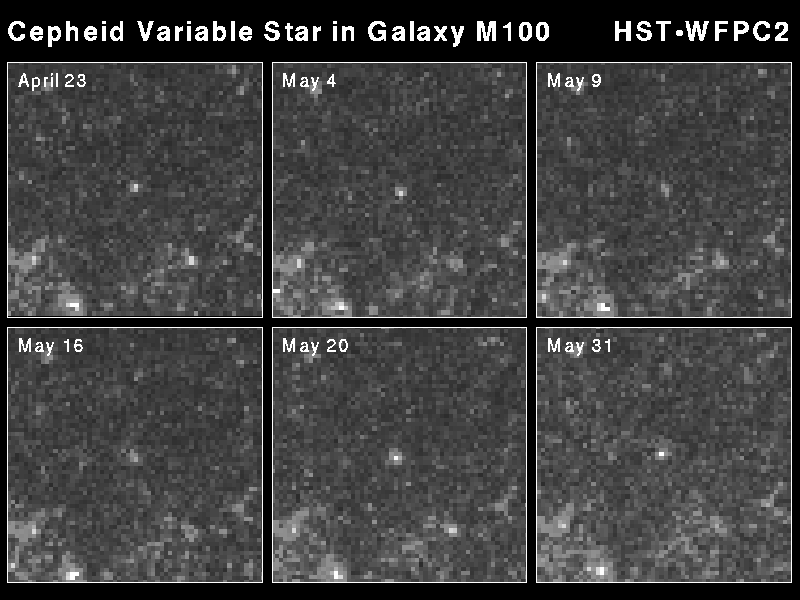
The Cepheid is barely detectable at the distance of M100 using the most powerful telescope there is! Remember, this is because the brightness of an object falls off as 1/R2, that is if you double the distance, the object is only 1/4th as bright, because the light spreads out as it travels:
A number of different types of the most luminous objects known were proposed to fulfill this need, but most were discarded as they led to rather uncertain distances. Fortunately, there is a type of object that can be seen to great distances: a Type I supernova! Supernovae are the most luminous stellar events in the Universe, with a luminosity that is BILLIONS of times that of the Sun. Some supernovae produce as much light as all of the other stars in the host galaxy. Thus, we finally have a probe that can be seen to very great distances--if we could calibrate their distances. To calibrate Type I supernovae, we used the other distance techniques (such as Cepheid varaibles) to estimate the distances to the nearest galaxies that had Type I supernovae explosions.
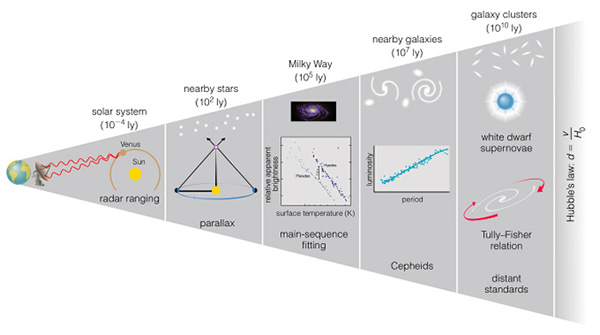
The calibration of Type I supernovae took a number of important steps, and this process is listed here:
This process is sometimes called the "cosmic distance scale ladder" as each step rests on the quailty/precision of the previous step, and is shown graphically below (Figure 20.21):
To make a long story short, the Type I supernovae were found to have a
pretty similar level of maximum brightness that they attain, and we can
therefore calibrate the distances
to other galaxies using these objects, as well as to calibrate some other
distance estimation techniques.
(The bad thing about supernovae is they occur at random, so not all galaxies
of interest will have one in a typical person's lifetime!)