
Before we leave stellar evolution, we should talk about a few of the more interesting results of the process. We have discussed supernovae, and how they produce neutron stars. There are a number of interesting types of neutron star systems. One variety of neutron stars have very high magnetic fields (a million or more times stronger than the Earth's). Because hot gas is easily trapped by a magnetic field, it spirals inward to the neutron star and emits x-rays, visual light and radio waves. If the neutron star is spinning, this emission is like a seachlight as it passes by our field of view. We see a short lived pulse of energy, then nothing, then another pulse, etc. These objects are called "Pulsars" as shown in the textbook:
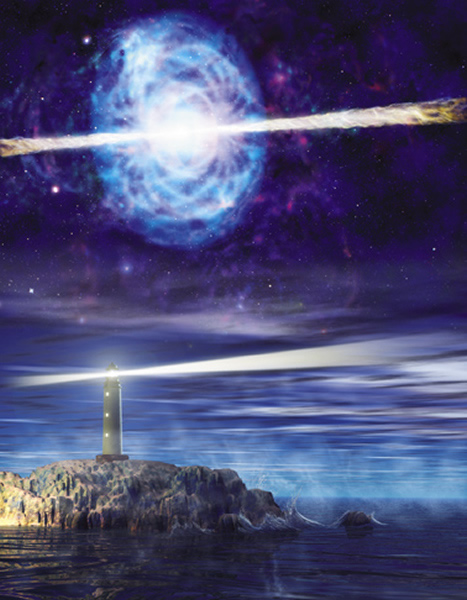
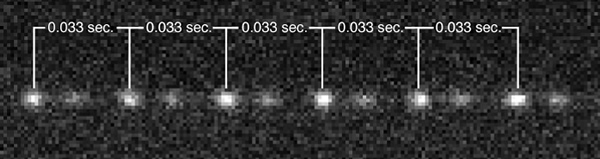
The amazing thing about pulsars is how fast some neutron stars are spinning, up to 625 times per second! Here is a sequence of pictures of a pulsar as it blinks on and off as the searchlight beam rotates around:
In some cases, neutron stars are born in binary star systems---even though there was a supernova, the companion star keeps orbiting around the neutron star. In many of these cases, the companion is so close to the neutron star that it transfers material to it, and as this material spirals in towards the surface of the neutron star, it forms a hot disk of material (called an accretion disk). This disk is very hot, and emits large quantities of x-rays, and we call these systems "X-ray binaries". These are not the only kind of "interacting binaries" that contain a degenerate object. Both black holes and white dwarfs can be involved in such systems. In fact, this is the only way we have detected the black holes that result from supernova explosions, by their interactions with a companion star in orbit around the black hole (for a site listing the fun facts about black holes, go here).
The most plentiful type of binary system containing a degenerate star are those with white dwarfs (since most stars in the universe are low mass, white dwarfs outnumber neutron stars and black holes by factors of many thousands). Some white dwarfs are in very close binary systems. If the white dwarf and companion star are very close to each other, the white dwarf's gravity distorts the companion and transfers matter. This matter forms an accretion disk, but one that is not as hot as those around neutron stars. Here is an artist's conception:
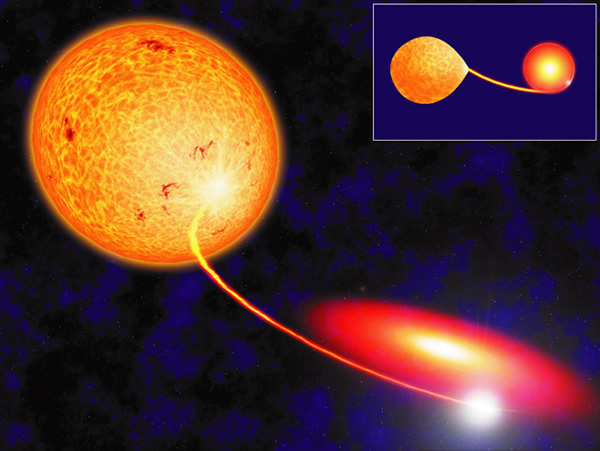
Accretion disks are highly variable in size and temperature, and a variety of phenomena are possible. Sometimes we get small scale activity on the time scale of seconds, and sometimes we get large scale activity on the time scale of weeks. In the latter cases, the accretion disk can get hot and expand, causing a dramatic brightening (by a factor on 100 or more). These outbursts have lead to calling these objects "cataclysmic variables", as in times past, these events were thought to be cataclysmic. We now know that they are quite routine, some systems have outbursts every week or two.
Note that the material passing through the accretion disks in cataclysmic variables and x-ray binaries eventually makes its way down to the surface of the white dwarf. Here it can accumulate. Remember that in a white dwarf it is the electron degeneracy pressure that keeps it from contracting into a neutron star. In a neutron star it is the neutron degeneracy pressure that keeps it from contracting into a black hole. A white dwarf cannot have a higher mass than 1.35 Msun or else it will collapse into a neutron star. If the white dwarf keeps accumulating material from its companion star, there is a possibility of it growing in size until it reaches 1.35 Msun. When it does so, electron degeneracy pressure can no longer support the white dwarf, and it quickly collapses into a neutron star. The result is a supernova, but a slightly different kind than those that result from massive star eruptions. In the case of massive star eruptions, there is a lot of hydrogen gas still around, and much of the energy of the eruption is absorbed in the old red supergiant atmosphere. In the white dwarf supernovae, there is no such material. We call the white dwarf supernovae, "Type I" supernovae, and the massive star supernovae "Type II" supernovae to keep them straight. Their spectra are dramatically different, as are their outburst light curves (the plot of brightness with time):

Both types of supernovae reach to more than 109 solar luminosities, though the white dwarf supernovae are a bit more luminous. Because their explosions are all very similar (white dwarf collapses), the total amount of energy emitted by Type I supernovae are all similar--thus we can use them to estimate distances. We will encounter them again soon.
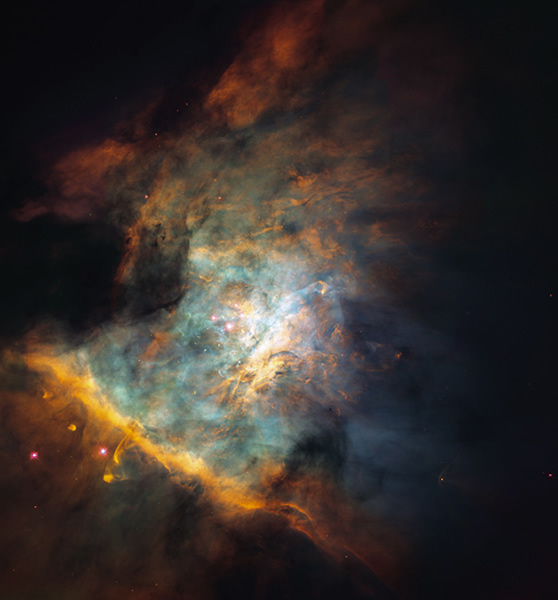
We have developed some useful tools such as spectroscopy, photometry, and the HR diagram to understand how stars are born, live, and die. We have described how stars are born, but have not yet fully described the regions in which stellar birth is occurring. Stars form in dense clouds of gas and dust that are very cold--10 to 30 K. In these clouds, which can contain several million solar masses of hydrogen, there are denser regions that collapse down to form stars. Let's now discuss these regions. The raw material for forming stars is contained in "molecular clouds". Molecules in open space, or near stars, are relatively rare because only a little bit of ultraviolet light destroys the molecule. The cold clouds of hydrogen gas that collapse to form stars are full of molecules--most of them are molecules of hydrogen (H2), two atoms of hydrogen bound to each other. But other molecules exist, even complex molecules like alcohol and simple amino acids have been discovered in these clouds.
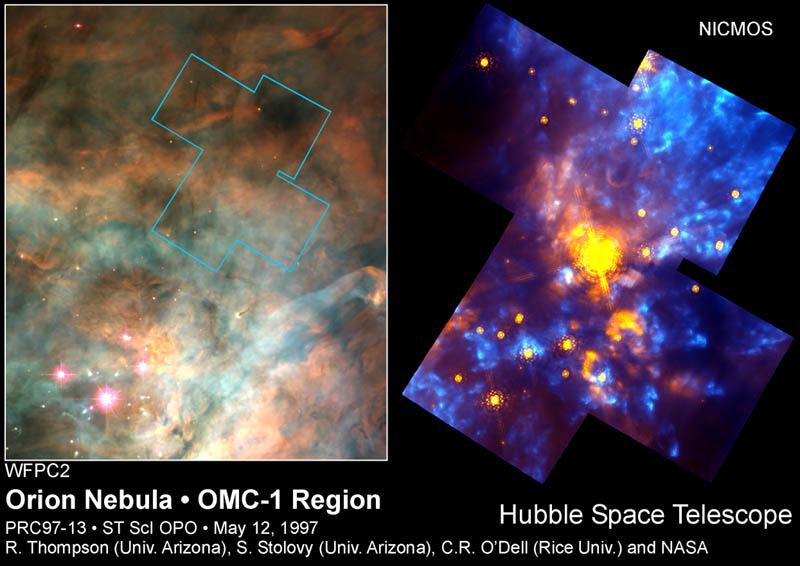
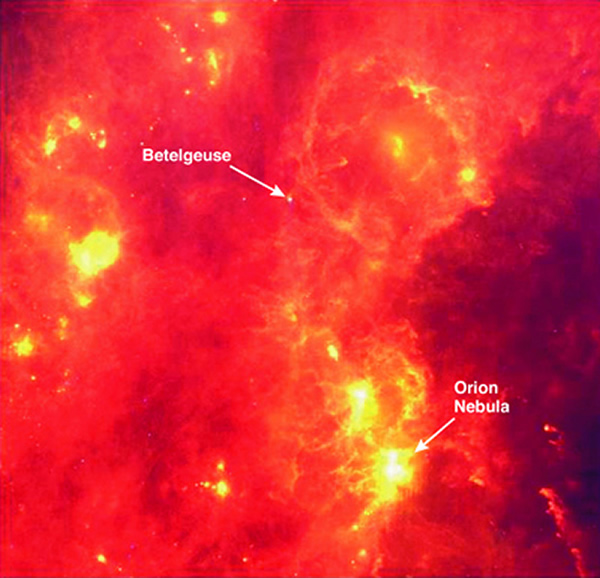
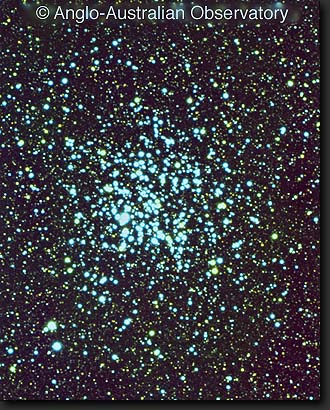
As pieces of the cloud begin to collapse down to form stars, energy--mostly infrared heat radiation---begins to be generated. Remember that when stars are first forming, they have low temperatures, below a few thousand degrees. These types of objects emit most of their light in the infrared. If we were to use our eyes, or a camera that can only detect visible light, we cannot see these objects: they are too cool, and are hidden by obscuring dust. For example, in the two photos below, we see a young star forming region in the optical (outlined, irregular box) on the left, and the infrared view on the right.


Astronomers do not directly measure luminosity or temperature when they look at a cluster of stars---they measure apparent magnitude ("V") and a color. For example they use a blue filter ("B") and a green ("V") filter, and subtract the apparent magnitude in the V filter from the B filter ("B-V"), they they plot the V magnitude vs. the B-V color. Let's go back to blackbodies. In this plot are the curves for a hot blackbody (10,000 K, cyan), and a cool blackbody (4,000 K, red). The "x" axis is the wavelength in nanometers (10-9 meters), while the "y" axis is the amount of light received on Earth. Remember, stars really closely resemble blackbodies, so plot shows you how different these two stars look.
Astronomers measure the colors of stars using filters. The standard set is "U" (ultraviolet), "B" (blue), "V" (visual=green), "R" (red), and "I" (infrared). But any two of these used on a star will allow us to determine its temperature. The commonly used filters are B and V. We denote the wavelength of these filters in this plot for each of the two stars with blue representing "B", and green representing "V". What we do is use an electronic detector to measure the amount of light passing through the B and V filters, and compare them. Note that a hot star emits more blue light, thus the amount of light measured in the blue filter is larger. A red star emits more red light than blue light, so it has a much smaller amount of light in B versus that seen in V. Next week you will learn about using the "B - V" color, all that this is is the difference of the magnitude measured in the two filters. Now magnitudes might be hard for you to understand, but they are calculated using this equation: B = −2.5log(amount of light detected) + constant
The constant "normalizes" the number, putting it on the correct scale. The same calculation is done for the V filter. You then take the difference of the two magnitudes: (B - V) to create a "color". Looking at our plot, we would expect B to be bigger than V for the hot star, and the reverse for the cool star. Unfortunately, the magnitude system is backwards, so more light = smaller magnitude, and that's why there is a minus sign on the equation!
Thus, we can create an HR diagram without actually knowing the luminosity or temperatures of the stars simply by plotting the V magnitude vs. the (B-V) color. This gives a "color-magnitude diagram", just like the HR diagram. A color-magnitude diagram for the globular cluster M15 shown here:
Note that we can figure out how far away this cluster is by noting where sun-like stars fall by using the B-V color of the sun: 0.63, and knowing the "absolute magnitude" of the Sun (4.5). The absolute magnitude of the Sun is how bright the Sun would appear if it was 10 parsecs (= 32.6 ly) from Earth. In the above plot, Sun-like stars have V = 22.5. That is a difference of 18 magnitudes fainter than the Sun, and that makes (using some math found here) the M15 cluster 39,800 parsecs from the Sun. Thus, HR diagrams (or color-magnitude diagrams) allow us to figure out both the age of, and the distance to, a star cluster!
Nature is fairly messy and inefficient at forming stars. Of a large molecular cloud that may have one million solar masses of gas from which stars could be formed, only a few thousand stars will actually be formed. The efficiency of the star formation process is very low, just a few percent at best. Why? As the protostars collapse, they eventually will generate large amounts of energy that pushes outwards on the surrounding gas. When large O and B stars are formed, they have such high luminosities they can disrupt large regions of the molecular clouds. Thus, there is a feedback mechanism that stops the formation of stars, and lowers the efficiency of the star formation process.
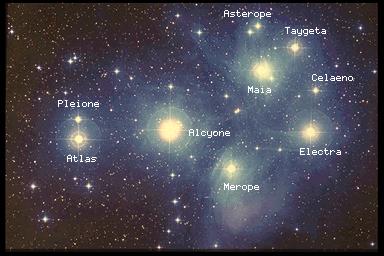
Nature also prefers to construct many smaller things than lots of large things. This goes for stars also... as described on page 552, in the typical star forming molecular cloud, for every star with a mass above 10 solar masses, there are 10 stars formed with masses between 2 and 10 solar masses, and 50 stars with masses between 0.5 and 2 solar masses, and about two hundred stars below 0.5 solar masses! This relationship is referred to as the stellar mass function. A typical star cluster like the Pleiades has a few luminous B stars, but two hundred much lower luminosity stars. Low mass stars dominate over all other types of stars---not only do fewer high mass stars get formed, their lifetimes are so short that most of them have blown up as supernovae before the low mass stars have reached the main sequence! While the lowest mass stars live for many 10's of billions of years.
Videos for stellar evolution:
And one for a break from studying