Stellar parallax is the only direct way to measure the distances to stars. Today, we will derive other information about stars. One of the first things you notice about stars when you look at the night time sky is that some are brighter than others. In fact, the brightest stars you see are about 200 times brighter than the faintest ones your eye can detect. Astronomers use a specific system to note how bright a star is: the magnitude system. The magnitude system was devised by the ancient Greek astronomer Hipparchus (ca. 190 to 120 B.C.). Hipparchus called the brightest stars in the sky "stars of the first magnitude", and the next rank were stars of the "second magnitude". The faintest stars Hiparchus could see were of the "sixth magnitude". In this system, the brighter the star, the smaller the number assigned to it. This backwards system sometimes confuses students, but as I have often said, astronomy is an old science, with traditions and language passed down over thousands of years, and it is this long history that has given us this system.
When modern electronic light detectors (using the "photoelectric effect") were first devised and used to measure the brightnesses of stars, it was found that a first magnitude star produced approximately 100X the electrical current of a sixth magnitude star. Since this current is a measure of how much energy is being recieved from the stars, we say that a first magnitude star is 100X brighter than a fifth magnitude star. And this is how the magnitude was finally defined and quantified. A difference of five magnitudes means a difference of 100 in brightness. If you are good with mathematics, you will find that a difference of one magnitude turns out to be a factor of 2.5 (2.5 x 2.5 x 2.5 x 2.5 x 2.5 = 100, we say that the fifth root of 100 = 1001/5 = 2.5, see the box on page 523).
The observed brightness of a star is called its apparent magnitude, because without measuring the star's distance, we do not know how much light it emits. When we do measure a star's distance, we can make a measurement of the star's true energy output. The total energy output of a star is called its luminosity. There are a variety of units of luminosity, but one way to measure luminosity is in Watts. In fact, this is just how light bulbs are (used to be?) categorized! Of course, the luminosity of a star is an astronomical quantity, for example the Sun has a luminosity of about 1026 Watts! Since this is another case of horribly large numbers, we often measure the luminosity of other stars in terms of how bright or dim they are compared to the Sun. For example, a star the emits 1027 Watts is 10X more luminous than the Sun, and we say it has 10 solar luminosities. A star that emits 1025 Watts is 1/10th as luminous as the Sun, so we say that it has a luminosity of 0.1 solar luminosities. Ok, we now have some of the language necessary to describe other stars. Now we need to incorporate the subjects of the last two classes--absorption line spectra, and the continuous spectrum---to further our discussion of other stars.
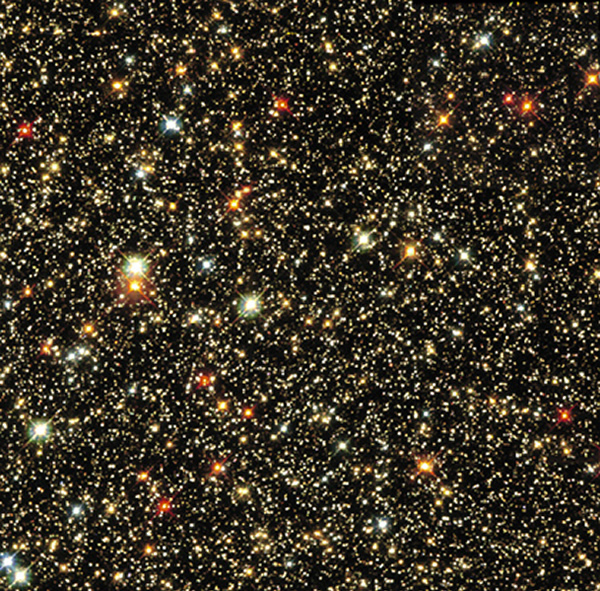
As figure 15.4 of the text (reproduced here) shows, stars come in a variety of colors:
These colors are quite subtle, but are also apparent to the naked eye if you look closely. One good example is the constellation Orion, the constellation highlight for February (and visible before dawn at this time of the year). The bright star in the shoulder of the giant, Betelgeuse ("the giant's armpit"), is reddish in color, while on the opposite corner (to the southwest) is the star Rigel (the "left leg" of the giant). Rigel is bluish in color. As we discussed in the last class, the color of an object gives us an idea of its temperature. Glowing red objects are cooler than those that glow with a blue color. This is the blackbody radiation spectrum, or the thermal radiation spectrum shown in Figure 5.19:
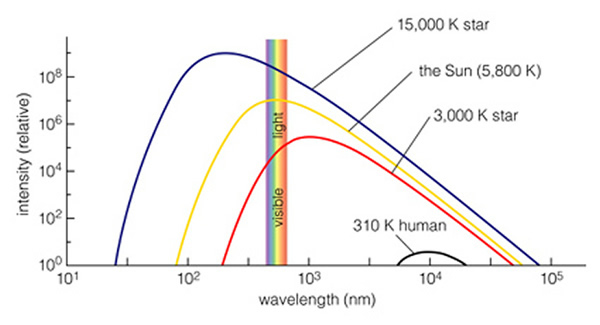
In fact, we now know that Betelgeuse has a temperature of about 3,000 K, while Rigel has a temperature of 12,000 K. Rigel is twice as hot as the Sun, and four times hotter than Betelgeuse. How can we know these numbers so precisely? Astronomers use the technique of photometry (which means measuring light) to determine the brightness of a star at a variety of different wavelengths. Because the shape of the thermal radiation spectrum is unique for each temperature, it emits a certain amount of blue light versus the amount of red light. By using color filters, astronomers can quantify how much energy is coming from the star depending on wavelength. This allows us a simple tool to determine the temperature of stars. A real example is shown here:
Astronomers break the visual spectrum into five pieces or domains: the violet, blue, green, yellow, and red. Using these five color filters, we can get a good handle on a star's temperature. The dotted line through the five data points is a thermal radiation spectrum that has a temperature of 9,500 K. The fit is never perfect, because there are always small measurement errors, as well as other details in the star's atmosphere that prevent it from being a perfect blackbody (note that the x-axis in this plot is in log10 of the wavelength in microns, where a micron is 10-6 meters, while the y-axis is in Watts/cm-2 which is the amount of energy hitting a square centimeter on the Earth--if we knew this star's distance we could convert this to a luminosity). Thus, we can use photometry to measure the temperatures of stars.
The other tool astronomers use to determine the nature of stars is through their absorption line spectra. Superposed on the continuum spectrum of every star is a set of absorption lines that come from the cooler regions right above the star's photosphere. When astronomers first used spectroscopes to look at stars, they were bewildered by the variety of spectra they saw, and it was very confusing:


Some stars had thousands of lines in their spectra, while others had very few. Before they could understand these spectra, they had to devise categories of stellar spectra to help order this chaos. The system chosen was based on the strength of the hydrogen lines--here is an emission line spectrum of hydrogen taken in a laboratory on Earth:

With this spectrum, you can identify the hydrogen lines in the spectra of stars (and you can do this for all of the other elements). Stars with the strongest hydrogen line absorption (shown as darker lines in the stellar spectra shown above) were called "A type" stars, the stars with the next strongest hydrogen lines were called "B type" stars. The first system extended from A all the way to S. It was later decided that many of the various classes were actually very similar, and today we really only have seven classes/types: A, B, F, G, K, M, and O. Using photometry, astronomers were able to determine the temperatures of the stars for each of these "spectral types". By measuring their parallaxes, we could measure their luminosities. The result is shown below, and in Table 15.1 on page 527 of the text:
| Star Type | Color | Approximate Surface Temperature | Average Mass (The Sun = 1) | Average Radius (The Sun = 1) | Average Luminosity (The Sun = 1) | Main Characteristics | Examples (Giants) |
|---|---|---|---|---|---|---|---|
| O | Violet | over 25,000 K | 60 | 15 | 1,400,000 | Singly ionized helium lines (HeII). Strong UV continuum. | ζ Pup |
| B | Blue | 11,000 - 25,000 K | 18 | 7 | 20,000 | Neutral helium lines (He I) in absorption. | (Rigel), Spica |
| A | Blue-white | 7,500 - 11,000 K | 3.2 | 2.5 | 80 | Hydrogen (HI) lines strongest for A stars. | Sirius, Vega |
| F | White | 6,000 - 7,500 K | 1.7 | 1.3 | 6 | Ca II absorption. Metallic lines become noticeable. | Procyon, (Canopus) |
| G | White to Yellow | 5,000 - 6,000 K | 1.1 | 1.1 | 1.2 | Absorption lines of neutral metallic atoms (e.g., Na, Ca). | Sun, (Capella) |
| K | Orange to Red | 3,500 - 5,000 K | 0.8 | 0.9 | 0.4 | Metallic lines, some blue continuum. | ε Eri, (Aldebaran) |
| M | Red | under 3,500 K | 0.3 | 0.4 | 0.04 | Some molecular bands of titanium oxide. | Proxima, (Antares) |
There are two additional columns in this table that need some explaining: mass and radius. How do astronomers get this type of information? This is harder to explain, and actually very difficult to measure. On page 172 of the text is a description of the "Doppler effect", the fact that a moving object has its spectrum shifted to the blue if it is coming towards us, and to the red if it is going away from us. Thus, spectra allow us to measure the velocity of an object. If two stars are orbiting each other, something called a "binary star", we see their spectra change as they orbit. This is shown in Figure 15.8:
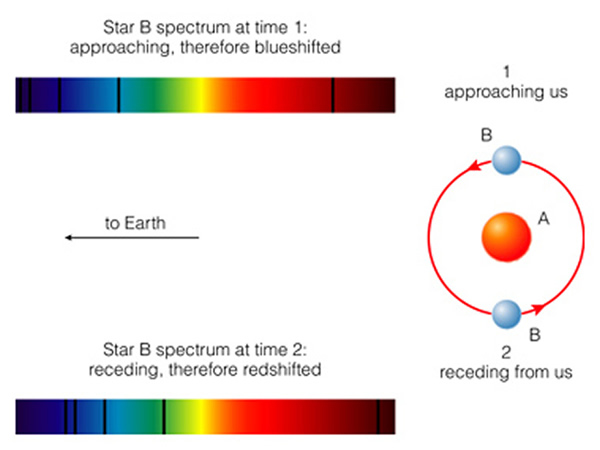
By measuring these changing velocities, we can actually measure the masses of stars (as shown in the "Mathematical Insight" box 15.4 on page 529). [This page has a nice animation. Doppler sounds.] This is a complex subject that we will encounter this effect again in a few weeks (expansion of the Universe), but for now, simply realize that there is a way to measure the masses of stars (the same technique has been used to discover planets around other stars), and the result is shown in the previous table.
How do we measure their radii? Just about all stars are much too far away to actually see a little disk like you would see when looking at the planets through a small telescope (though special techniques exist that allow us to measure the diameters of the closest, and biggest stars). We can actually measure the sizes of stars using "eclipsing binary stars". These are binary stars whose orbital plane is aligned with our line of sight. As one star moves in front of the other, it blocks out the light (an "eclipse"), and by measuring the time the star is eclipsed, allows us to measure its size. This is shown in figure 15.7:
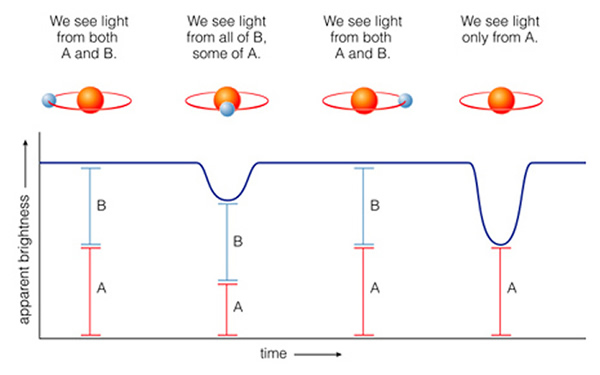
This is how astronomers measure the radii for each type of star. As you can see in the table, some stars are both hotter, more massive, larger in size and more luminous than the Sun, while others are less hot, less massive, smaller in size, and much less luminous than the Sun. The types of stars listed in the table that run from class O to M are called "main sequence stars". These are stars that are "normal" stars that fuse hydrogen into helium at their cores (note that O stars, and some B stars are actually hot enough to fuse helium into carbon at their cores). When astronomers first began to calibrate the properties of main sequence stars it was noticed that there were some stars that were not the same size or luminosity as main sequence stars. For example, there were some stars that had the same temperature as the Sun, but that emitted 3000X more light than the Sun (they had luminosities of 3000 solar luminosities). These stars also had radii that were more than 10X that of the Sun. Such large stars were quickly called "giant" or "supergiant" stars. In fact, there turn out to be giant and supergiant O stars, B stars, F stars, G stars, K stars, and M stars!
Antares is one example. If you look at its spectrum and its photometry, you would classify it as an M star. Normal, main sequence M stars are very small (less than half the radius of the Sun), and very cool (about 3,500K). But Antares has a luminosity of 10,000 Suns, and a radius that is nearly 500 times larger than the Sun. If you were to put Antares at the center of the solar system, the planets from Mercury to Mars would be orbiting inside Antares! It is a truly enormous object:

At the other end of the scale were some very hot stars (more than 8,000 K), but stars that only had 1/100th the luminosity of the Sun! A normal, main sequence star with a temperature of 10,000 K (an "A star") has a luminosity of 80X that of the Sun. How can a star be this hot, but be so faint? Because it is tiny! These objects are called "white dwarfs", because they are ("white") hot, and very small. In fact, their radii are less than 0.01 times that of the Sun---not much bigger than the planet Earth:

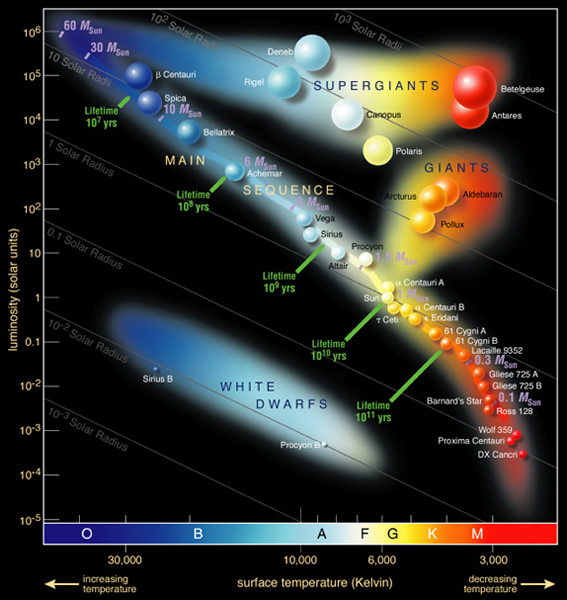
The two most important characteristics of stars are shown in this diagram: Luminosity (on the Y-axis), and the Temperature or spectral type (on the X-axis). In addition, there are diagonal lines which show the radius of each type of star (in solar radii), and green tickmarks that list how long each star lives. We will discuss the lives of stars in our next class.
1From "Zoom Astronomy"