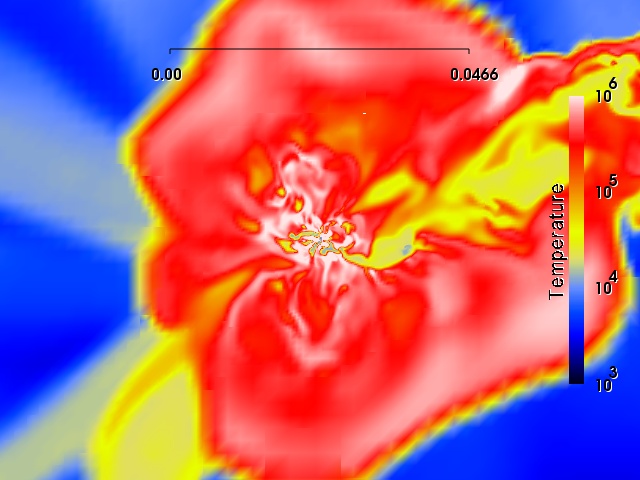
The physical state (gas density, temperature, velocity, and
metallicity) associated with a galaxy at z=1.3 is illustrated in
N-body + hydrodynamic simulations. Each image is 1 Mpc across
(co-moving). The galaxy stars, which are confined to the inner
central 20 kpc region, are not shown in these images, only the gas.
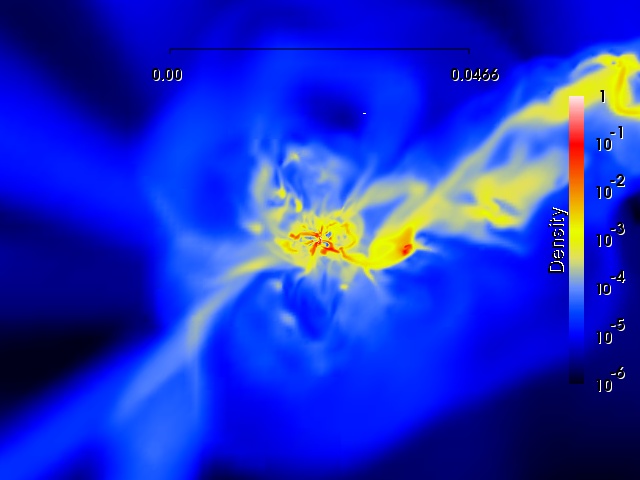
- (upper left) Hydrogen density distribution (red is 0.1, yellow
is 0.001).
- (upper right) Temperature distribution (white
should emit soft X-rays, green is photoionized).
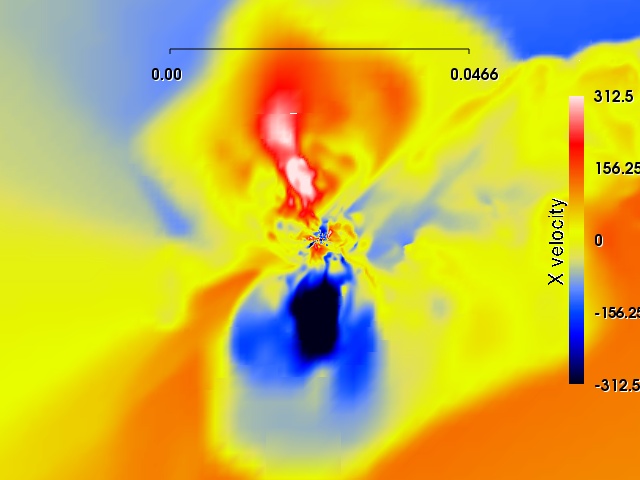
- (lower left) velocity field (red
upward and blue downward is 300 km/s OUTFLOW!).
- (lower right)
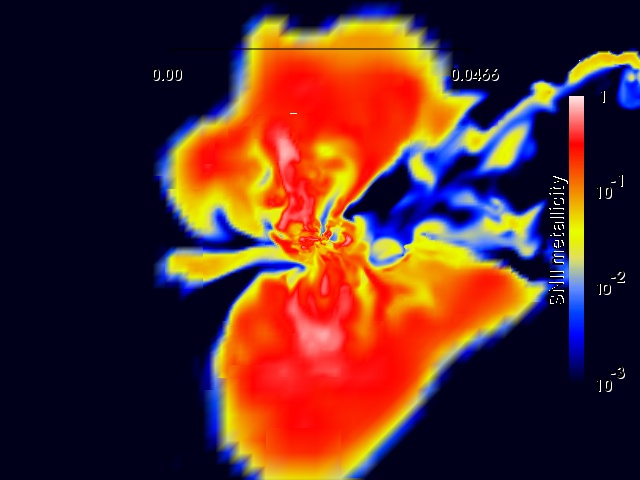
metallicity distribution (red is 0.5 solar, yellow is 0.05 solar).
What you are seeing: In the density slice (upper left panel), the
false color yellow gas has a density of n ~ 0.001 atoms per cubic
centimeter. The long extended structures to the upper right and lower
left are infalling filaments from the cosmic web. Red colored gas has
n ~ 0.1 atoms per cubic centimeter. In the temperature slice (upper
right panel), this gas corresponds to T ~ 30,000 Kelvin. Note the halo out
to 500 kpc that is T ~ few x 10^5 K. In the center of these images is
the galaxy, which is surrounded by turbulent, shock heated and
adiabatically cooling gas. The lower right panel shows the
metallicity of this halo gas (the filaments are chemically poor).
These metals are distributed along a direction perpendicular to the
infalling filaments. The lower left panel shows the gas kinematics in
the plane of the sky. The X direction is positive upward, so the red
colored gas is outflowing upward from the galaxy at ~300 km/s, whereas
the blue colored gas is outflowing downward from the galaxy at ~300
km/s.
The key to these simulations is that stellar feedback is required to
heat the gas, which then outflows (> 300 km/s) in a perpendicular
direction to the inflowing cool filaments. Natural advection propels
the metals to distances of 500 kpc. We run "mock" quasar lines of
sight through these halos, generate synthetic quasar spectra, study
the absorption lines from the MgII 2796,2803, CIV 1548,1550, and OVI
1031,1037 transitions, and compare them to observed spectra of these
transitions. We use the observations and mock spectra to place
constraints on the physics of stellar feedback. There are no ad-hoc
processes- everything seen here is the results of natural phsyical
processes in the simulations.
(Right click on images and drag on "View Image" to see enlarged
views.)